
Fitting a Quadratic Graph on a Picture
This is a task for learning about quadratic graph based on curve fitting. Pictures can be easily imported in a GeoGebra file. A quadratic function can be created and modified in several ways. We can input an equation and manually adjust the coefficients and/or dragging the curve around. Students can see how the equation is updated and make sense of the change in coefficients. Alternatively, we can use the FitPoly[] command after marking a few critical points in the picture.
See how the applet is made and how the graph can be manipulated.
|
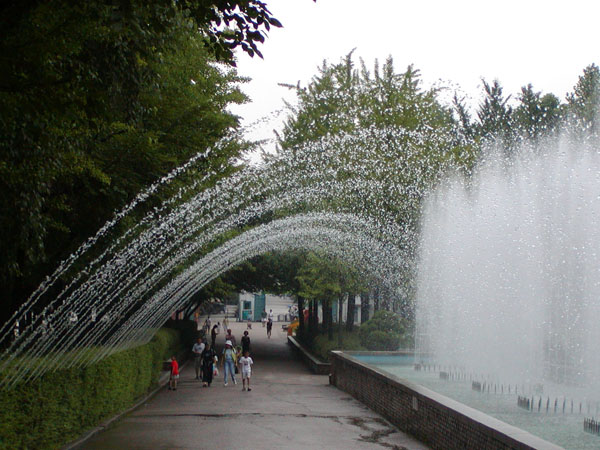
You may download this picture of fountain (on the right) for a try. Otherwise simply search for images of parabolas or other curves on the web and make your own applet of curve fitting.
|
|
